
Figure 4.
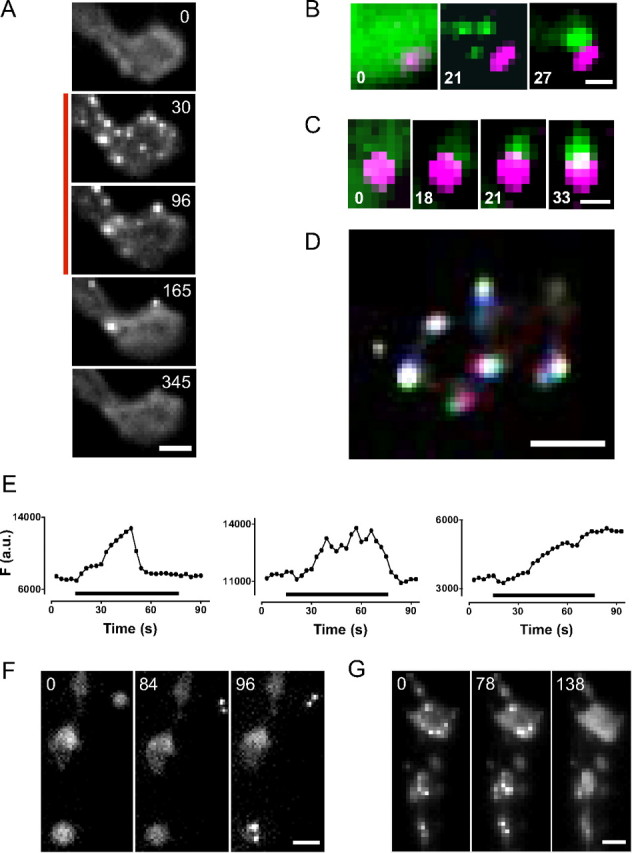
Activity-induced translocation of presynaptic CaMKII. A, Sequence of images of a type Ib bouton showing the localization of Camui before, during, and after stimulation at 70 Hz for 120 s (indicated by bar on left). Fluorescein optics were used. Scale bar, 2 μm. B, Appearance and aggregation of Camui puncta (green) adjacent to an AZ marked with the strawberry-tagged BRP-short (magenta). Scale bar, 0.5 μm. Only part of a bouton is shown. C, Appearance and growth of a Camui punctum near an AZ. Scale bar, 0.5 μm. Only part of a bouton is shown. D, Movement of Camui puncta. Three sequential time-lapse images taken 3 s apart were presented in different colors (red, green, and blue) and then superimposed so that immobile signal is white and motion is indicated by other colors. Scale bar, 2 μm. E, Time courses for three CaMKII clusters from a single bouton induced by 60 s stimulation at 70 Hz. F (a.u.), Punctum fluorescence in arbitrary units. F, G, Sequences of fluorescence images acquired through the cuticle of undissected larvae show CaMKII clustering (F) and dispersal (G) in different boutons. Scale bars, 2 μm. For all images, numbers show time in seconds.