
Fig. 4.
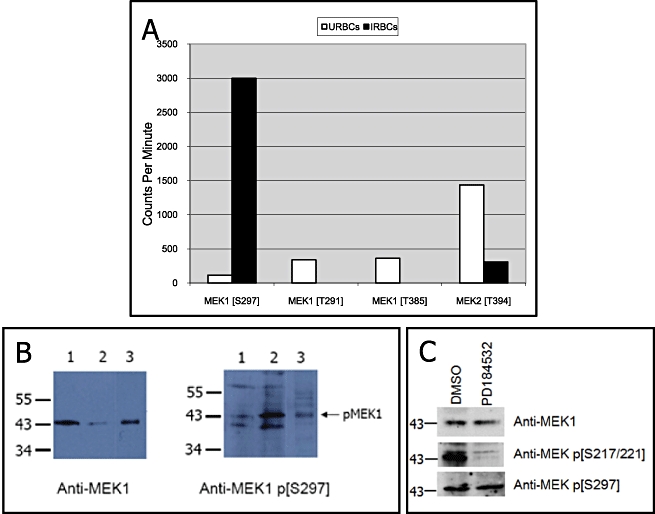
Phosphorylation status of host cell MEK1 in P. falciparum-infected erythrocytes.
A. Quantification of Western blot data obtained from Kinexus experiment (see text for details and Fig. S5 for the original Western blot). The autoradiogram was scanned to obtain a counts per minute (c.p.m.) value (scan time of 60 s). Data in Figs 4A and S5 were generated at Kinexus (Vancouver, Canada) using cell extracts provided by the authors.
B. Western blot of total-cell extracts from uRBCs (lane 1) and iRBCs (lane 2). Lane 3 is a positive control extract (3T3 cells treated with PDGF) provided by the supplier of the antibodies (Biosource). The membrane was probed first with an anti-MEK1 antibody recognizing both phosphorylated and non-phosphorylated forms of the protein (left panel). The same membrane was then probed with the anti-phospho-MEK1 p[S297] (right panel).
C. Effect of the PD184532 MEK inhibitor on MEK phosphorylation. Synchronous P. falciparum cultures were treated at ring stage with 20 µM PD184532 (or with the DMSO vehicle only) for 24 h prior to Western blot analysis using the antibodies indicated to the right.