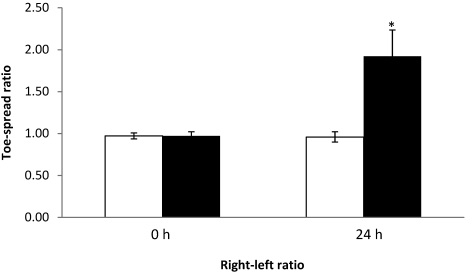
Figure 10.
Right–left ratios at 0 and 24 h of control mice injected with nonspiked serum (control, white column) and mice injected with serum spiked with BoNT (black column). In the nonspiked control group, the left EDL muscles were injected with 3 µL serum. In the spiked serum group, the left EDL muscles were injected with 3 µL of the spiked serum (1 LD50 per mouse). Both groups received GBS in the right EDL muscle. *, value differs significantly (P < 0.05) from that of the GBS control group.

