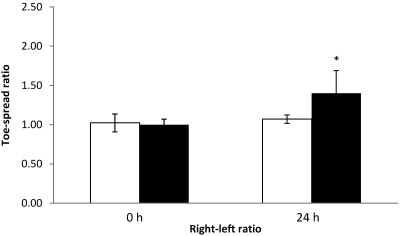
Figure 11.
Right–left ratios at 0 and 24 h of control mice injected with nonspiked milk (white column) and mice injected with milk spiked with BoNT (black column). In the nonspiked control group, the left EDL muscles were injected with 3 µL nonspiked milk. In the spiked milk group, the left EDL muscles were injected with 3 µL of spiked milk (1 LD50 per mouse). Both groups received GBS in the right EDL muscle. *, value differs significantly (P < 0.05) from that of the GBS control group.

