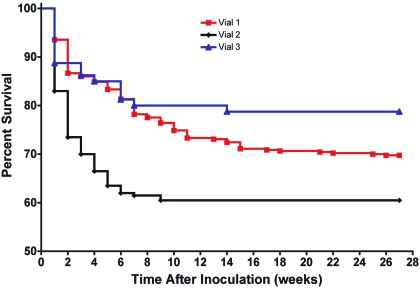
Figure 2.
Average percentage survival (tumor latency) curves depicting tumor formation in adult athymic nude mice over time in response to the dose of MDCK cells injected from vial 1 (mean of 5 assays), vial 2 (mean of 3 assays), and vial 3 (1 assay). Average survival values were estimated from the tumor incidence recorded weekly. Kaplan–Meier analysis indicated that the differences between the average tumor-latency data for vial 1 compared with vial 2 were significant (P ≤ 0.0001) as were those between vials 2 and 3 (P ≤ 0.0040), whereas the differences between vials 1 and 3 were nonsignificant (P = 0.1495).

