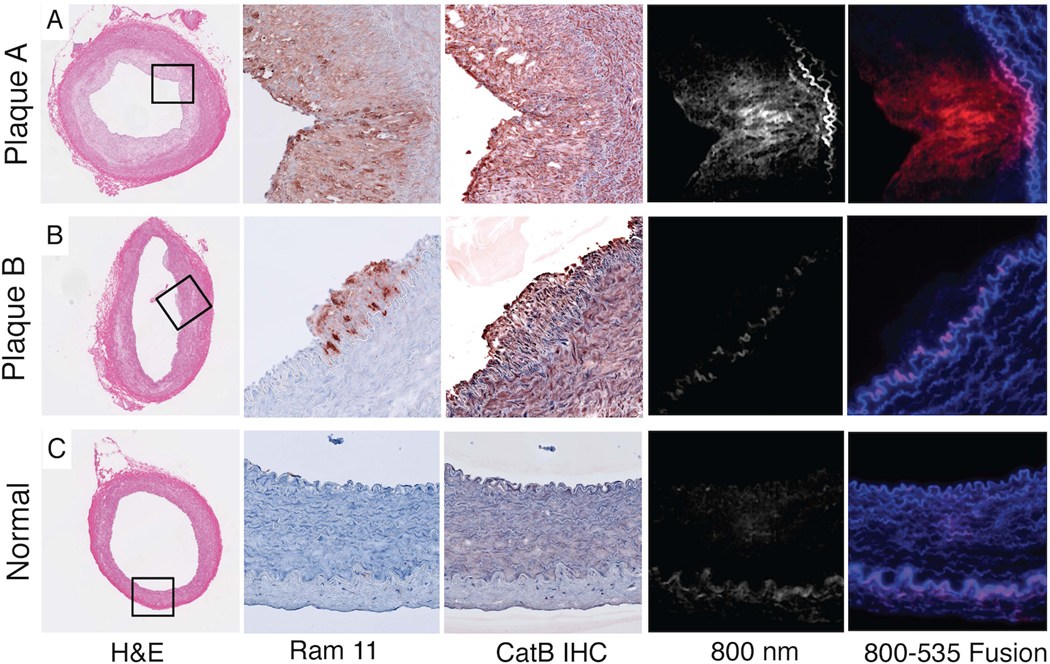
Figure 7.
Histopathological and immunoblotting assessments of aortic inflammation. In each row, the five images depict correlative arterial sections of hematoxylin and eosin staining (10X), immunoreactive macrophages (RAM-11, 20X), immunoreactive cathepsin B (catB, 20X), NIR fluorescence at 800nm, and merged 800nm-535 nm fluorescence, with red color denoting 800nm signal induced by cysteine protease activation of Prosense VM110, and blue color denoting signal at 535nm originating from autofluorescence. (A) In an advanced plaque, immunoreactive macrophages and cathepsin B, and intimal NIRF protease activity signals are evident. (B) Early stage atheroma demonstrates macrophages and cathepsin B in the intima and media but little NIRF cysteine protease activity (800nm image). (C) Section of a normal artery. Elastin fibers provide a source of autofluorescence (blue color) on fusion fluorescence microscopy images. (D) Cathepsin B and β-actin immunoblot of lysates from normal and plaque containing vessel demonstrates cathepsin B in atherosclerotic aortas. Pro-catB denotes the 46 kD pre-cathepsin B band, and mature catB denotes the 25 kD and 30 kD cathepsin B bands.


