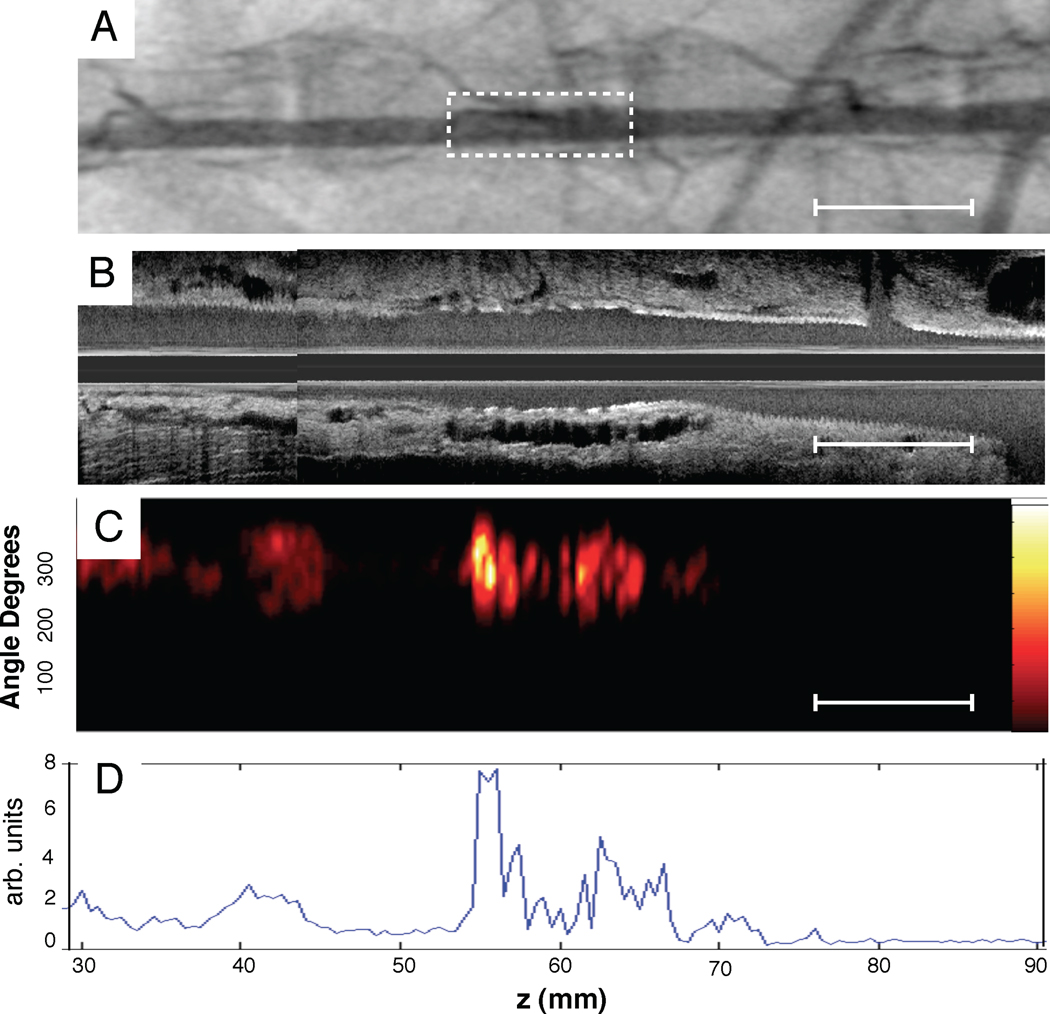
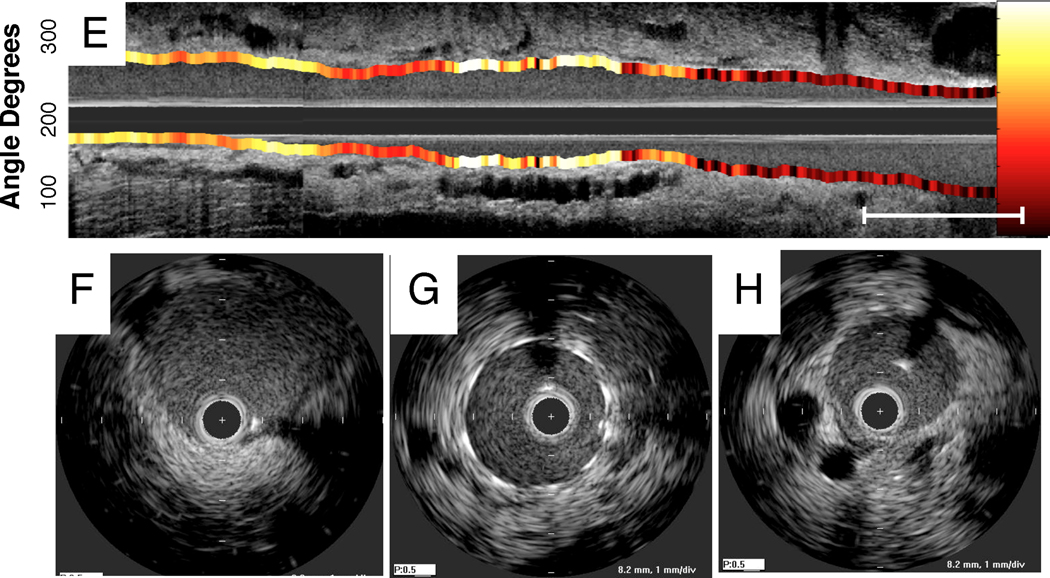
Figure 8.
Representative multimodality NIRF molecular and IVUS anatomical imaging of arterial inflammation at day 7 following coronary stent implantation. (A) Angiogram of an implanted bare metal stent in the abdominal aorta. Dotted rectangle denotes stent position. (B,C) Longitudinal IVUS and NIRF catheter pullbacks demonstrate NIRF signal within the stent. NIRF signal collection was performed through blood without flushing, in 3.5mm diameter vessels. (D) Corresponding 1D plot of the angle-averaged 2D NIRF signal at each axial point. (E) Longitudinal IVUS and NIRF fusion image (yellow/white=strongest NIRF signal intensity, red/black=lowest NIRF signal intensity). (F,G,H) Axial IVUS images from PTCA alone, stent and normal vessel zones, respectively.


