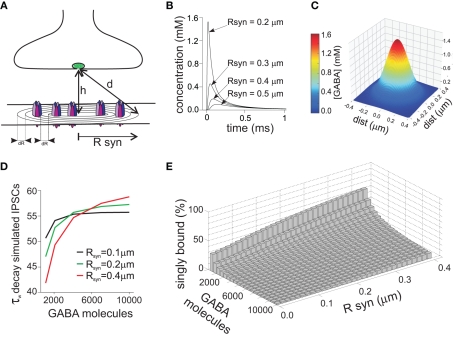
Figure 2.
Receptors located at different distances from the disk center sense a different GABA concentration due to non-homogeneity of the neurotransmitter concentration profile. (A) Schematic representation of the GABAergic synapses. The distance from the releasing site to the synaptic site is indicated by d, while Rsyn represents the synaptic disk radius. (B) Simulated time course of the GABA concentration following release of 4000 GABA molecules, measured at different distances from the disk center. Please note that in the vicinity of the disk center the GABA concentration peak is markedly higher with respect to the disk periphery. (C) Simulated spatial profile of GABA diffusion in the cleft obtained 30 μs after the instantaneous release of 4000 GABA molecules. (D) Dependence of the decay time of simulated IPSCs on the number of GABA molecules released. At low number of GABA molecules released, receptors located at the disk periphery sense a low dose of GABA, activating preferentially in the monoliganded configuration, and contributing therefore to IPSCs speed-up. Please note that the IPSCs decay was also influenced by the synapse radius. (E) Summary of the relative weight of monoliganded GABAAR on the simulated IPSCs at different GABA molecules released and synaptic radiuses. Please note that conditions generating low saturation (low number of molecules released and/or large synaptic radiuses) favor the singly bound state activation, while high concentration pulses at small synapses determine almost complete activation in doubly bound state. Modified from Petrini et al. (2011) with permission.

