
Figure 1.
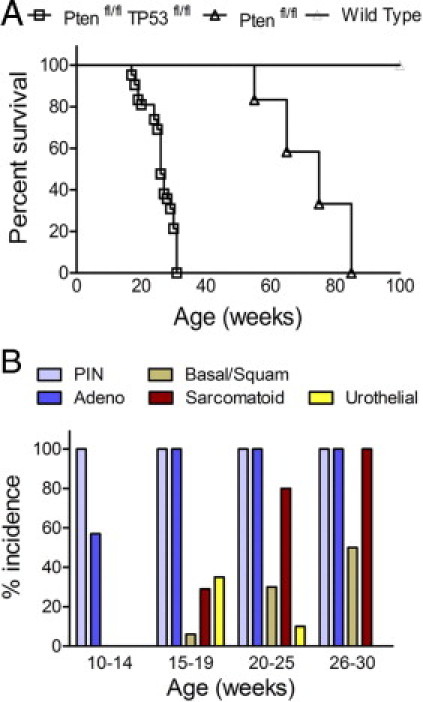
Survival rate and tumor phenotype incidence for PB-Cre4+; Ptenfl/fl;TP53fl/fl mice. A: Kaplan-Meier curve showing survival rates for PB-Cre4+;Ptenfl/fl;TP53fl/fl (n = 41) (Ptenfl/fl TP53fl/fl), open squares; PB-Cre4−; Ptenfl/fl;TP53fl/fl littermates (n = 38) (wild-type, straight line); and PB-Cre4+;Ptenfl/fl (n = 12) (Ptenfl/fl, open triangle). B: Histogram showing the percentage of PB-Cre4+; Ptenfl/fl;TP53fl/fl mice in each age group with a tumor containing the indicated phenotype (%incidence): 10 to 14 weeks (n = 14), 15 to 19 weeks (n = 17), 20 to 25 weeks (n = 10), and 26 to 30 weeks (n = 12). Adeno, adenocarcinoma; Basal/Squam, basal/squamous carcinoma; PIN, mouse prostatic intraepithelial neoplasia; Sarcomatoid, spindle cell carcinoma; Urothelial, urothelial carcinoma.