
Figure 7.
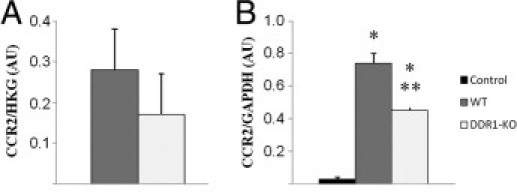
Expression of the MCP1/CCL2 ligand, CCR2, on isolated peritoneal macrophages (A) and on the renal cortex (B). Data are mean ± SEM. *P < 0.01 versus nonobstructed kidney; **P < 0.01 versus obstructed WT kidney.
Official websites use .gov
A
.gov website belongs to an official
government organization in the United States.
Secure .gov websites use HTTPS
A lock (
) or https:// means you've safely
connected to the .gov website. Share sensitive
information only on official, secure websites.
Expression of the MCP1/CCL2 ligand, CCR2, on isolated peritoneal macrophages (A) and on the renal cortex (B). Data are mean ± SEM. *P < 0.01 versus nonobstructed kidney; **P < 0.01 versus obstructed WT kidney.