
Figure 4.
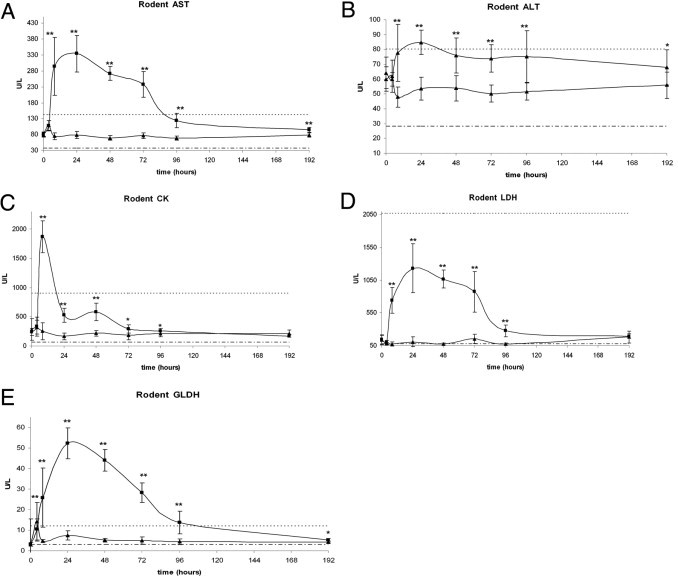
Clinical pathology serum enzyme levels in rats after treatment with CLO liposomes: AST (A), ALT (B), CK (C), LDH (D), and GLDH (E). There were significant increases in all enzyme values after CLO treatment within the first 48 hours. *P ≤ 0.05, **P ≤ 0.01 versus control. Triangles indicate control; squares indicate treated; dashed line indicates lower limit; and dotted line indicates upper limit.