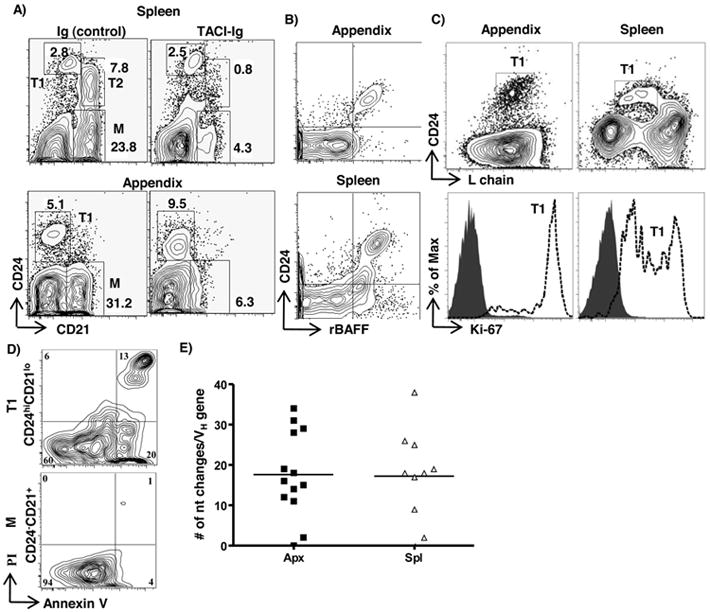
Figure 2. Functional analysis of transitional B cells.

A) Flow cytometric analysis of appendix and spleen cells from TACI-Ig-treated and control (Ig)-treated rabbits stained with anti-CD21 and anti-CD24 mAb. Flow cytometric analysis of appendix and spleen cells from conventional rabbits stained with B) Anti-CD24 and recombinant soluble BAFF (rBAFF) and C) Upper: anti-CD24 and anti-L chain; lower: anti-Ki67 (open histograms) of T1 cells (from upper diagram). Shaded histogram = isotype control. D) Flow cytometric analysis of sorted splenic T1(CD24hiCD21lo) (upper) and mature B cells (CD24lo/-CD21+) (lower) stained with Annexin V and propidium iodide (PI) after 12-15 hrs in culture with anti-Ig (10μg/ml) [goat (F(ab’) anti-rabbit IgG (H+L); Jackson ImmunoResearch Laboratories], E) Somatic diversification of VH regions of PCR-amplified VDJ genes from splenic (spl) and appendix (apx) T1 B cells. The horizontal bar represents average number of nucleotide changes/VH gene (excluding D and J regions); each dot represents one VH gene sequence. Sequences obtained from three adult rabbits are shown. Data in B) to D) are representative of 2-3 independent experiments. Data in A) are representative of two control and three TACI-Ig treated rabbits.
