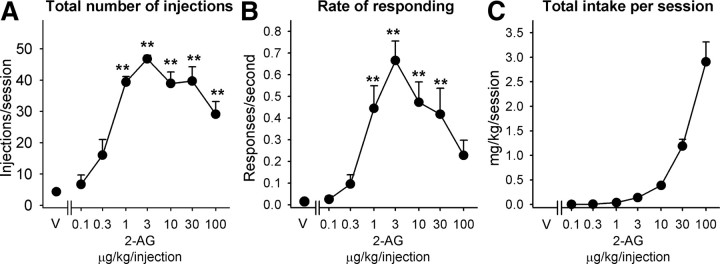
Figure 3.
Effects of varying injection dose on self-administration of 2-AG. A–C, Number of injections of 2-AG per session (A), overall rates of responding in the presence of the green light signaling 2-AG availability (B), and total 2-AG intake per session (C) are shown as a function of injection dose of drug. Each point represents the mean ± SEM (n = 4) of the last three sessions under each 2-AG unit dose condition and under a vehicle condition. **p < 0.01 post hoc comparisons with the vehicle conditions. V, Vehicle.

