Figure 2.

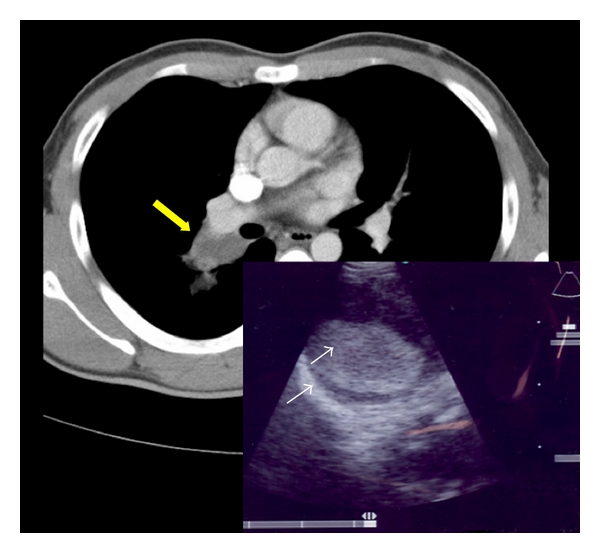
CT scan showing a soft tissue lesion at the right hilum (yellow arrow). Insert image: EBUS image showing a round lesion with an echogenic center and thickened hyperechoic walls (white arrows).

CT scan showing a soft tissue lesion at the right hilum (yellow arrow). Insert image: EBUS image showing a round lesion with an echogenic center and thickened hyperechoic walls (white arrows).