
Figure 2.
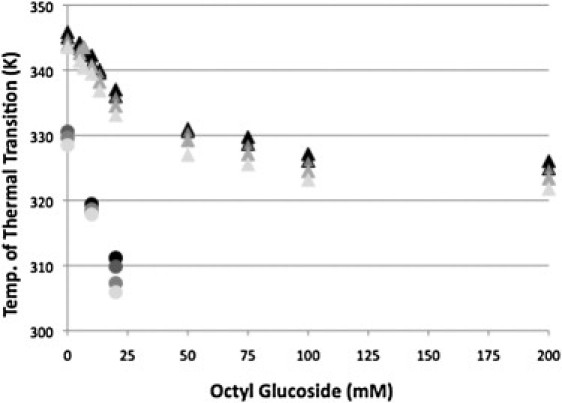
Tm of rhodopsin (triangles) and opsin (circles) thermal denaturation as a function of detergent concentration. The data were obtained at scan rates of 1.5 (black), 1.0 (dark gray), 0.5 (gray), and 0.25 (light gray) K/min.
Official websites use .gov
A
.gov website belongs to an official
government organization in the United States.
Secure .gov websites use HTTPS
A lock (
) or https:// means you've safely
connected to the .gov website. Share sensitive
information only on official, secure websites.
Tm of rhodopsin (triangles) and opsin (circles) thermal denaturation as a function of detergent concentration. The data were obtained at scan rates of 1.5 (black), 1.0 (dark gray), 0.5 (gray), and 0.25 (light gray) K/min.