
Figure 5.
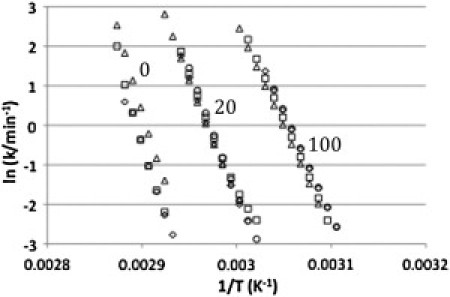
Arrhenius plots for the thermal denaturation of rhodopsin in intact disk membranes, in 20 mM, and in 100 mM OG. First-order rate constants were derived from the irreversible denaturation of the protein according to the two-state model. The different symbols used indicate the scan rates of each experiment (circles, 0.25 K/min; diamonds, 0.5 K/min; squares, 1 K/min; triangles, 1.5 K/min.)