
Figure 6.
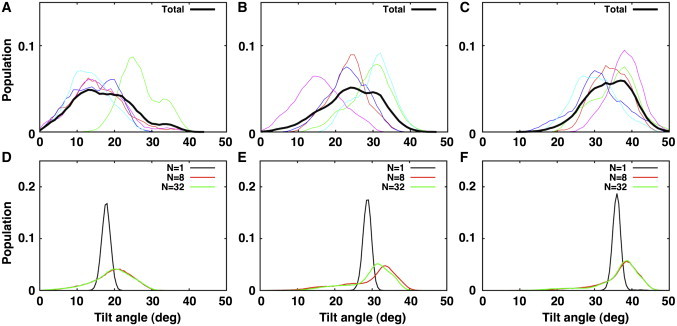
VpuTM's τ-distribution of structure ensembles in different bilayer environment. (A–C) Distributions from standard MD simulations in DOPC, DMPC, and DLPC, respectively. (Colored lines) Individual simulation trajectories. (Black lines) Combined trajectories. (D–F) Distributions from SSNMR-ED in DOPC, DMPC, and DLPC, respectively.