
Figure 1.
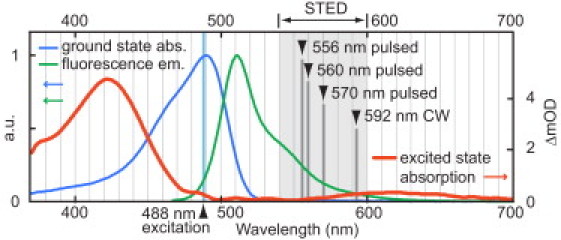
Excited state absorption (ESA) of eGFP and spectral rationale for employed stimulated emission depletion (STED) wavelengths. Normalized ground state absorption and fluorescence emission spectra are juxtaposed with the ESA spectrum measured 100 ps after excitation. STED wavelengths reported in this Letter are indicated. The unit on the ordinate at right is change in optical density ×10−3.