
Figure 2.
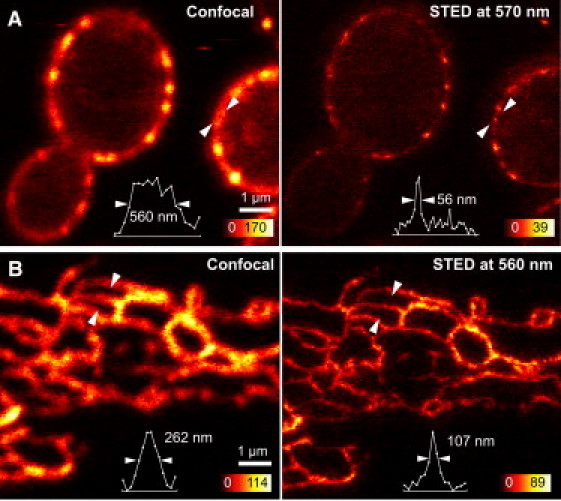
STED images of single cells. (A) STED image (right) of living yeast cells expressing GFP (S65T) on eisosomes, with confocal image for comparison (left). Line profiles (below) were taken of the image features (open arrows); values indicated are FWHM. Pulsed STED light at 570 nm was used, with applied excitation and STED powers of 6 μW and 8 mW, respectively. (B) Living Vero cells expressing eGFP in the endoplasmic reticulum measured using a STED wavelength of 560 nm. The original 20 × 20 μm STED recording took ∼8 s to acquire. All data shown is raw.