
Figure 5.
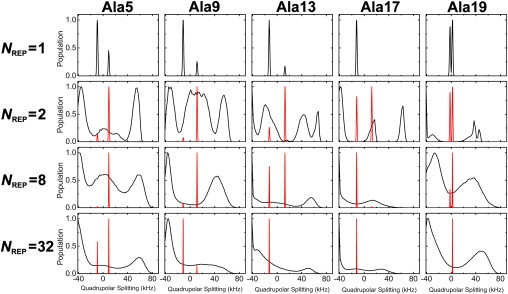
Distribution of calculated (black) and ensemble averaged (red) DQS of each alanine as a function of NREP. In the case of NREP = 1, the ensemble-averaged DQS does not exist. The population is normalized by setting the highest value to 1 for easy comparison for each system.