
Figure 3.
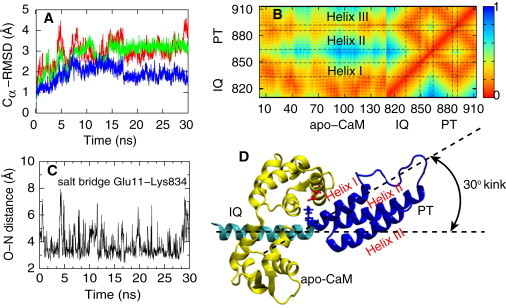
Results from the equilibrium simulation of myosin VI (simulation PIC-eq in Table 1).The simulated system includes the PT domain and the IQ motif with a bound apo-CaM. (A) Cα-RMSD values of the whole simulated system (red), of the PT domain (green), and of apo-CaM (blue). The simulated structures relaxed within 20 ns. (B) Contact map between residues (0, close; 1, far away). In addition to an expected close contact between apo-CaM and IQ motif, apo-CaM also contacts the PT domain, maintaining the kink (see text) between the IQ motif and the PT domain. (C) Salt bridge between Glu11 of the apo-CaM and Lys834 of the myosin VI, observed through the respective O–N distance. (D) Simulated system with IQ motif (cyan), apo-CaM (yellow), and PT domain (blue) showing a zig-zag geometry of the helix I-helix II-helix III system. The crystal structure (PDB 3GN4) was obtained from Mukherjea et al. (22). A 30° kink forms between IQ motif and PT domain.