
Figure 5.
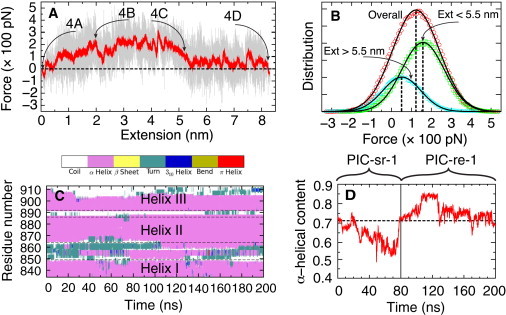
Characterization of PT domain extension. (A) Force-extension data from simulation PIC-sr-1. The force shown is measured through the expression f = −k(x(t) – x0(t)) and the extension through e(t) = x(t) − x(0). Force values were taken every 2 ps (gray trace); these force values are averaged over a gliding 200-ps window (red). Large forces arise when the PT domain becomes less compliant to the imposed moving constraint x0(t), i.e., when it does not follow the constraint readily, increasing the separation x0(t) − x(t). Labels 4A, 4B, 4C, and 4D correspond to the simulation snapshots in Fig. 4. The region of highest force, at ∼4 nm, corresponds to a free energy barrier characterizing the transition B → C in Fig. 4. (B) Force distribution at different steps of PT domain extension. The first step was sampled over extensions <5.5 nm (green) and the second step over extensions >5.5 nm (blue). Force distribution for the overall process is also shown (red). The distributions can be matched closely to Gaussians, yielding average forces of 158 pN (step 1), 52 pN (step 2), and 123 pN (overall). (C) Time evolution of PT domain secondary structure. The α-helices are seen to remain intact; only a small portion of helix III is lost. The analysis for this figure used the Timeline plugin of VMD (33). (D) Time evolution of α-helical content. Initially (t < 80 ns), a decrease of α-helical content arises that is regained quickly during the final, i.e., 120-ns long, relaxation simulation. The α-helical content exceeds the starting value (dotted line) due to the formation of some transient helical structure in the loop region between helices I and II (residues 851–863).