
Figure 7.
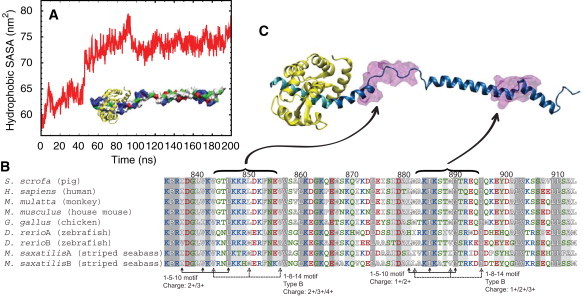
Exposed hydrophobic solvent-accessible surface area (SASA) and potential binding of additional CaMs. (A) Time evolution of hydrophobic SASA during the stretching simulation PIC-sr-1 and the subsequent relaxation simulation PIC-re-1. The forced unfolding of the PT domain results in a large increase of hydrophobic SASA. (Inset) Extended PT domain and the IQ motif in surface representation, colored by residue type (blue, positively charged; red, negatively charged; green, hydrophilic; white, hydrophobic); IQ-bound CaM (yellow, cartoon representation). (B) Sequence alignment of myosin VI PT domains from several species. This study involves the PT domain from Sus scrofa and the S. scrofa myosin VI sequence 834–913 was used for alignment. The alignment was performed using MultiSeq (75), implemented as a plugin in VMD (33). The residues are colored by residue type as in panel A. (Shaded areas) Sequence conservation among all nine sequences. (Lighter-shaded areas) Sequence conservation among more than seven of the nine sequences examined. CaM binding motifs identified are labeled, and the charges of the sequence given (note that for the 1-5-10 motif, the total charge includes contributions from three additional residues preceding the motif (67)). (C) Location of the 1-8-14 and 1-5-10 motifs highlighted in the PT domain. Two transparent purple areas depict the motifs, located at the loop regions. (Cyan) IQ-domain; (yellow) apo-CaM; and (blue) extended PT domain.