
Figure 3.
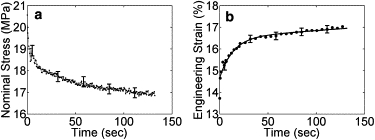
Mechanical response of a representative collagen fibril specimen. (a) Nominal-stress-time curve, . (b) Engineering-strain-time curve, . For the sake of clarity, the error bars are shown every 50 data points for both curves, and the symbols are shown every 3, 5, or 10 data points for the engineering-strain-time curve. The line represents the fitted curve, .