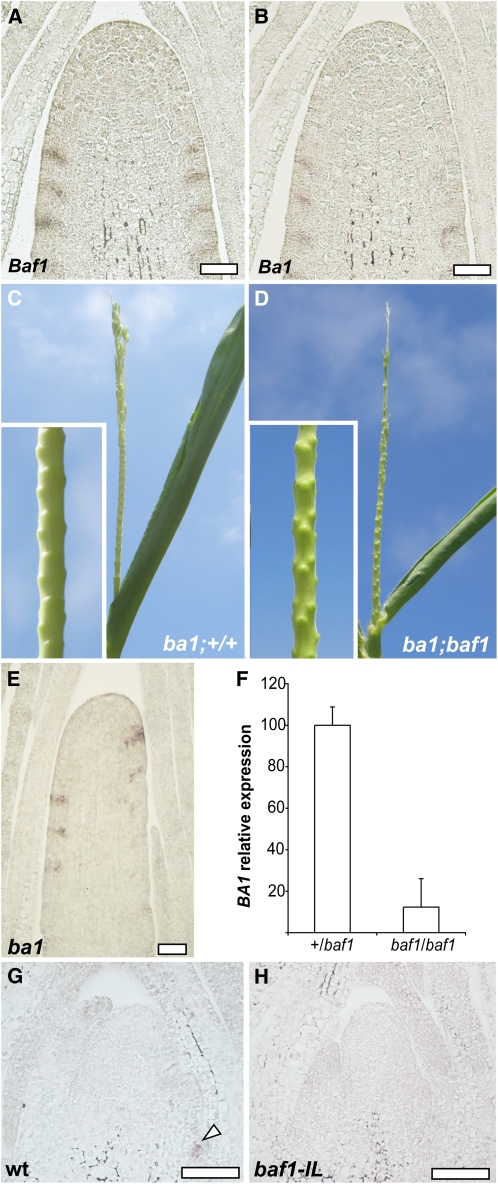
Figure 7.
The Relationship between Baf1 and Ba1.
(A) and (B) Consecutive sections of an inflorescence meristem of a developing ear hybridized with Baf1 (A) or Ba1 (B) probes show overlapping expression patterns.
(C) and (D) ba1 baf1 double mutant tassels show no noticeable phenotypic differences from single ba1 mutants. Suppressed bracts are still evident in both single and double mutants (close-ups).
(E) In situ localization of Baf1 in a ba1 mutant tassel shows a regular pattern of expression of Baf1.
(F) Quantitative RT-PCR of Ba1 in pools of seedlings of heterozygous or homozygous baf1-IL mutant plants. The expression levels are relative to actin, and the expression in the heterozygous sample is set to 100. Error bars represent sd.
(G) and (H) In situ localization of Ba1 in wild-type (wt) (G) and baf1-IL mutant (H) seedlings. Arrowhead points to Ba1 expression in a developing axillary meristem.
Bars = 50 μm.

