Figure 5.
Effects of Osmotic Stress on Meristemoid Division Activity and Proliferation Zone.
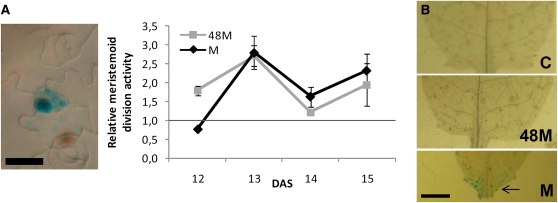
Plants were transferred to mannitol-containing plates at 9 DAS and afterward transferred back to control (C) plates after 48 h of mannitol treatment (48M) or kept on mannitol plates (M). Leaf 3 was dissected for further analysis.
(A) Meristemoid division activity as determined by CYCB1;1:DBox-GUS staining, expressed relative to control. Data on right are means ± se from three independent experiments with 6 to 12 leaves measured in each experiment. Photo on left shows a representative active meristemoid. Bar = 10 μm.
(B) Leaf base of leaf 3 stained for CYCB1;1:DBox-GUS expression at 14 DAS. Some mitotic activity can still be seen in the proliferation zone of mannitol-treated leaves (indicated with an arrow). Bar = 0.5 mm.

