Figure 6.
Osmotic Stress Effects on Cell Cycle.
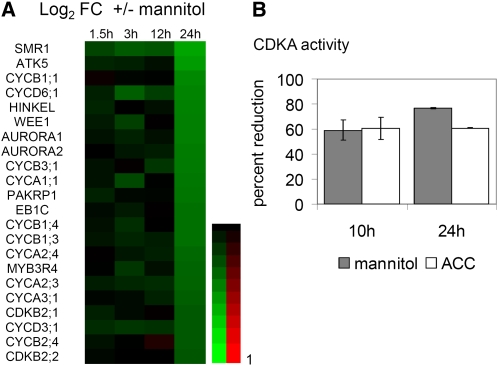
(A) Heat map of selected cell cycle genes differentially regulated by osmotic stress in the 3rd fully proliferating leaf 1.5, 3, 12, and 24 h after stress imposition. Data are from Affymetrix ATH1 arrays and are expressed as the log2 of fold change (mannitol, control). Red and green indicate upregulation and downregulation, respectively. A key to the gene names is provided in the Supplemental Table 3 online.
(B) Relative CDKA activity measured in the 3rd proliferating leaf, microdissected from plants transferred to control, mannitol-, or ACC-containing medium 10 and 24 h after transfer. Data show means ± se from two (24 h) or three (10 h) independent experiments with ± 50 leaves pooled in each experiment.

