Figure 8.
Involvement of Ethylene Signaling in Cell Cycle Arrest.
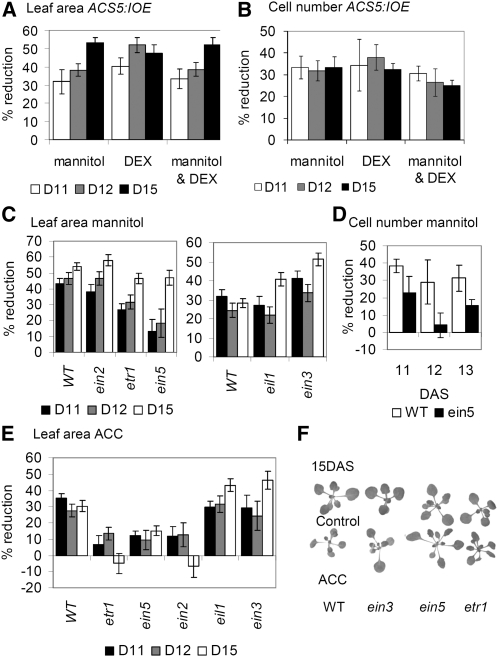
(A) and (B) Percentage of reduction of leaf area (A) and cell number (B) in the 3rd leaf of plants harboring the inducible ACS5 construct (ACS5:IOE5) transferred to media containing DEX, mannitol, or DEX and mannitol at 9 DAS, compared with transfer to control medium.
(C) to (F) Phenotypes of ethylene-insensitive mutants. Percentage of reduction in leaf area (C) and in cell number (D) of the 3rd leaf of mannitol-treated ethylene-insensitive mutants versus wild-type (WT) plants. Percentage of reduction in leaf area of the 3rd leaf of ACC-treated ethylene-insensitive mutants versus wild-type plants (E). Photographs of wild-type, ein3, etr1, and ein5 seedlings 6 d after transfer to ACC (F).
Data in (A) to (E) show means ± se for two or three independent experiments. Leaf area was measured for minimum 8 to 10 leaves in each experiment. Cellular data were from four leaves in each experiment. D, DAS.

