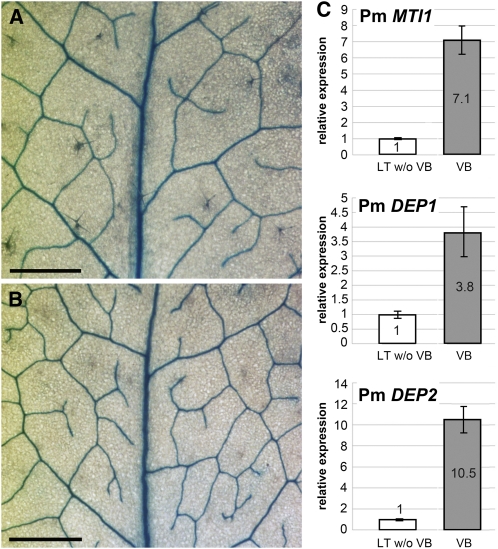
Figure 8.
Vascular-Specific Expression of Arabidopsis and Plantago MTI and DEP Genes.
(A) GUS-stained vasculature in a source leaf from a pAt-MTI1/GUS plant.
(B) GUS-stained vasculature in a source leaf from a pAt-DEP1/GUS plant.
(C) qRT-PCR analyses of Pm MTI1, Pm DEP1, and Pm DEP2 expression were performed on total RNA from isolated vascular bundles (VB) or on RNA from leaf tissue, from which all major veins had been extracted (LT w/o VB; n = 3; ±sd).
Bars = 0.5 mm.
[See online article for color version of this figure.]

