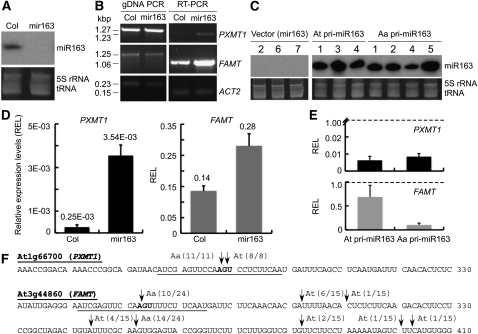
Figure 4.
Effects of miR163 Overexpression on Target Gene Regulation in the T-DNA Insertion Mutant Plants for mir163.
(A) Small RNA gel blot analysis showing presence of miR163 (24 nucleotides) in the wild type (Col) and absence of miR163 expression in the mir163 mutant.
(B) RT-PCR analysis of miR163 target genes, PXMT1 (At1g66700) and FAMT (At3g44860), in Col and mir163 lines. Corresponding genomic DNA was amplified as PCR controls, and Actin 2 was used as expression controls.
(C) Small RNA gel blot analysis of total RNA in mir163 mutant plants overexpressing At pri-miR163 or Aa pri-miR163. All RNA gel blots used the same probe labeling reaction for hybridization and had the same exposure time for image acquisition. Numbers above the gel correspond to different independent transgenic lines.
(D) qRT-PCR analysis of miR163 target gene expression in mir163 mutant plants. REL, relative expression level.
(E) qRT-PCR analysis of miR163 target gene expression (PXMT1 and FAMT) in mir163 plants overexpressing either At or Aa pri-miR163. The average R.E.L. was calculated between miR163 overexpressing lines and the vector control (dotted lines). Values are mean ± se, which are calculated from multiple transgenic lines as shown in (C). Except for PXMT1 in (E), the expression differences were statistically significant at P < 0.001.
(F) Analysis of miR163-mediated mRNA cleavage using 5′ rapid amplification of cDNA ends. Partial sequences of PXMT1 (At1g66700) and FAMT (At3g44860) are shown. Predicted target sites in PXMT1 and FAMT are underlined. The arrows indicate the detected cleavage sites in Aa transcripts (Aa) and At transcripts (At or without designation), respectively. The frequencies of cloned sequences are shown next to the arrows.

