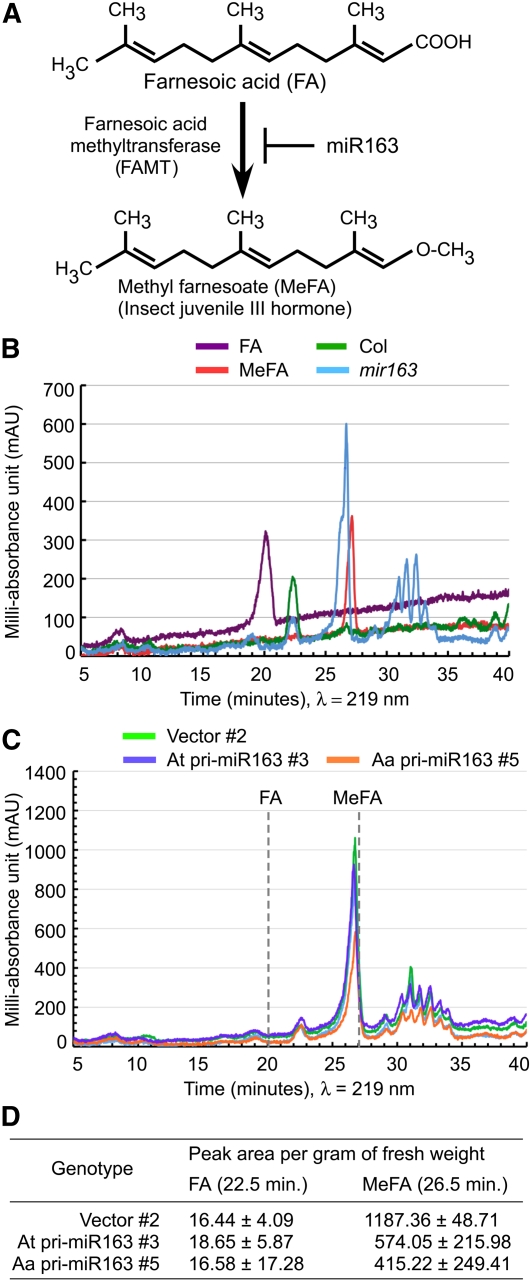
Figure 5.
Effects of miR163 Mutation and Overexpression on Target Metabolites in the mir163 Mutant Plants.
(A) Conversion of FA to MeFA by FAMT is negatively regulated by miR163.
(B) HPLC chromatographs showing peaks of crude plant (leaf) extracts from Col (green) and mir163 (blue). Standards of FA (purple) and MeFA (red) are shown.
(C) HPLC chromatographs showing peaks of crude extracts in the vector control (green), At-miR163 transgenic lines (blue), and Aa-miR163 transgenic lines (orange), all in the mir163 mutant background.
(D) Quantification of peak areas near FA and MeFA (peak area per gram of fresh leaf weight) detected in the experiment in (C) with three biological replications. Values are mean ± sd.

