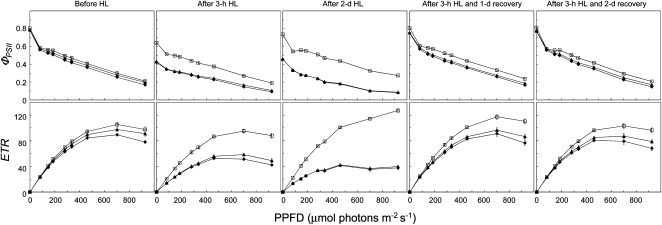
Figure 2.
Light–Response Curves of PSII Quantum Yield and ETR in Wild-Type and lqy1 Mutants.
The measurements were performed at the following light intensities: 0, 81, 145, 186, 281, 335, 461, 701, and 926 μmol photons m−2 s−1. Data for Col wild-type (open squares), lqy1-1 (filled diamonds), and lqy1-2 (filled triangles) plants are presented as mean ± se (n = 8). HL, high light. Note that lqy1-1 and 1-2 response curves are superimposed in the after 2-d HL ΦPSII and PSII ETR graphs due to their similar phenotypes.

