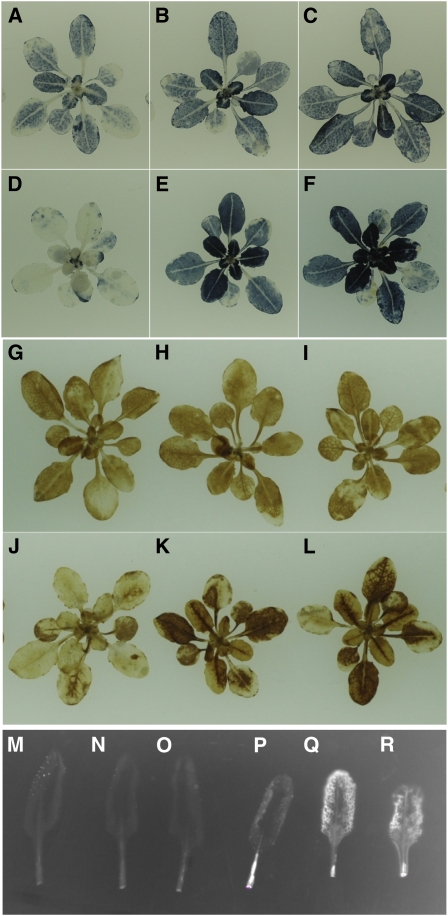
Figure 3.
Analysis of ROS in Wild-Type and lqy1 Mutants.
(A) to (C) NBT staining of O2− in Col wild-type (A), lqy1-1 (B), and lqy1-2 (C) plants under growth light.
(D) to (F) NBT staining of O2− in Col wild-type (D), lqy1-1 (E), and lqy1-2 (F) plants after growing under high light for 2 d.
(G) to (I) DAB staining of H2O2 in Col wild-type (G), lqy1-1 (H), and lqy1-2 (I) plants under growth light.
(J) to (L) DAB staining of H2O2 in Col wild-type (G), lqy1-1 (H), and lqy1-2 (I) plants after growing under high light for 2 d.
(M) to (O) Detection of 1O2 with SOSG in Col wild-type (M), lqy1-1 (N), and lqy1-2 (O) plants under growth light.
(P) to (R) Detection of 1O2 with SOSG in Col wild-type (P), lqy1-1 (Q), and lqy1-2 (R) plants after growing under high light for 2 d.

