
Figure 4.
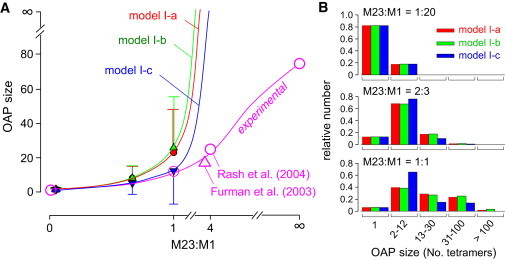
OAP size predictions of first-generation non-constrained models. (A) Average OAP size (number of AQP4 tetramers/OAP) as a function of the M23:M1 ratio for three variations (a-c) of nonconstrained first-generation models (mean ± SD). Open circles and triangle are from published freeze-fracture electron micrographs (19,30). (B) Number histograms of the distribution of OAP size for models I-a, I-b, and I-c at M23:M1 ratios of 1:20, 2:3, and 1:1.