
Figure 4.
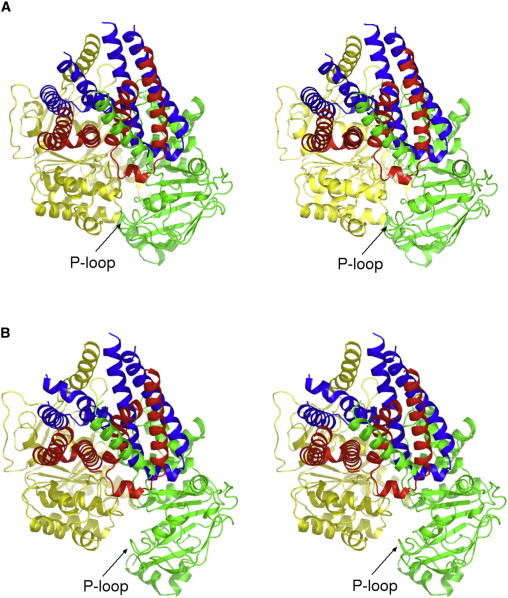
Opening of the apo active site via rotation of the core subdomain. Stereo pairs of the starting structure (A) and from the apo/ATP simulation 2B at t = 92 ns; (B) showing rotation of the core subdomain in the apo active site. ICLs 1 and 2 from monomer A are in red and ICLs 1 and 2 from monomer B are blue. ICL3 and the NBD from monomer A are in green and ICL3 and the NBD from monomer B are yellow. The core subdomain of the monomer A NBD (apo NBD) is in the bottom right quadrant with its P-loop indicated by an arrow. The view is from the membrane, angled to illustrate the movement of the P-loop away from the opposite NBD.