
Figure 2.
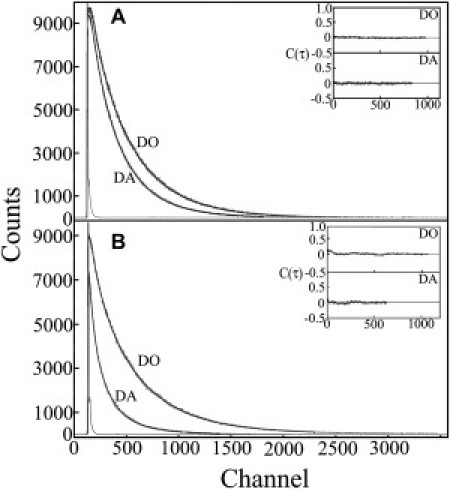
Typical experimental decay curves of the donor in the presence (DA) and absence (DO) of an acceptor in apoAK [no ligand = open conformation] (A) and in holoAK [saturating concentration of Ap5A = closed conformation] (B), measured at 25°C in 50 mM Tris buffer pH 7.8. Each pair of decay curves was fit in a joint analysis to a distance distribution model. (Insets) Autocorrelation of the residuals from each model fit.