
Figure 3.
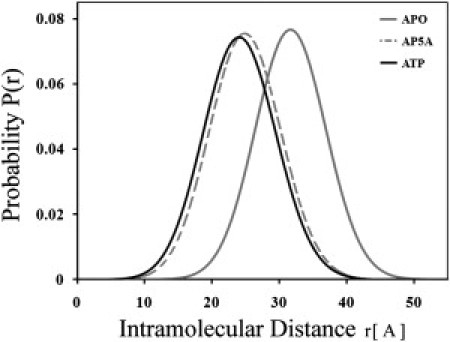
Distribution of donor-acceptor distances obtained by global modeling of fluorescence decay curves. The interprobe distance distribution in AK(142W, 203Cca) in the absence of TMAO at room temperature was determined under saturating concentrations of the inhibitor Ap5A and ATP as well as in the ligand free, apoAK. The shift of distribution toward smaller distances accompanying ligand binding, reflecting domain closure, and partial overlap of the distributions is shown.