
Figure 7.
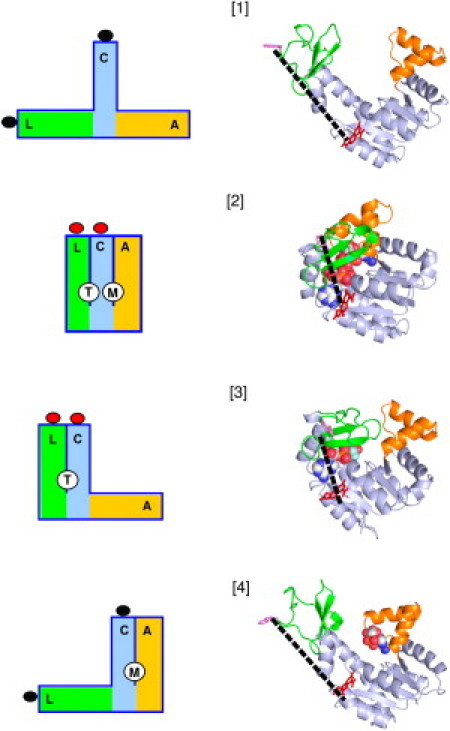
Schematic diagrams and structural cartoons of the four conformational states specified in the model described in the text. In the schematic diagrams, L (green), C (cyan), and A (orange), respectively, designate the LID, CORE, and AMP domains. T and M designate the ATP and AMP binding sites created upon closure of the LID and AMP domains, respectively. The lobes attached to the ends of the L and C domains represent donor and acceptor fluorophores attached to residues 142 and 203, respectively, and the change in color represents the presence of FRET upon closure of the LID domain. For the structural cartoons, the individual domains are colored as in the diagrams. (Dashed lines) Distance between donor and acceptor fluorophores in each structure.