
Figure 8.
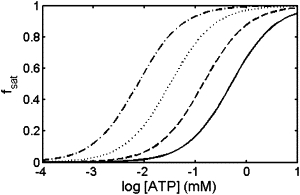
Fractional saturation of AK with ATP calculated using Eq. 12, plotted as a function of ATP concentration in the presence of the following concentrations of TMAO: 0 g/L (solid curve), 100 g/L (dashed curve), 200 g/L (dotted curve), and 300 g/L (dot-dashed curve).