
Figure 3.
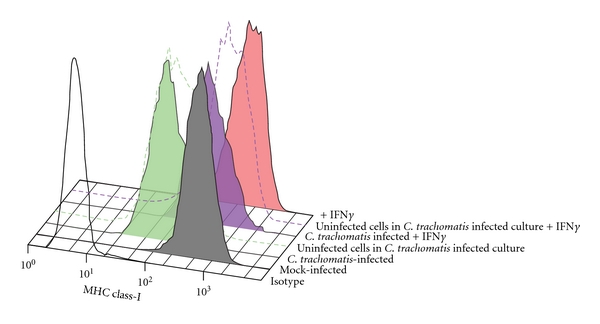
MHC class I surface expression on infected and uninfected bystander endocervical epithelial cells in cultures exposed to C. trachomatis. Surface expression levels of MHC class I were assessed in the two populations of cells found in C. trachomatis-exposed cultures. A2En cells were either mock infected (gray) or exposed to C. trachomatis at MOI of 2, with cKSFM alone (green) or cKSFM with 30 ng/mL IFN gamma (blue). Mock-infected A2EN cells exposed to 30 ng/mL IFN gamma (red) were analyzed in parallel. Isotype control is shown as black line histogram. Surface expression of MHC class I is depicted using histograms. The green solid histogram represents C. trachomatis-infected cells, the dashed green line represents bystander uninfected cells, the blue solid histogram represents C. trachomatis-infected cells exposed to IFN gamma, and the blue dashed line represents uninfected cells in IFN gamma-exposed cultures. Downregulation of MHC class I expression was observed on both the C. trachomatis-infected cells and on bystander cells. Data is representative of experiments performed in duplicate three times.