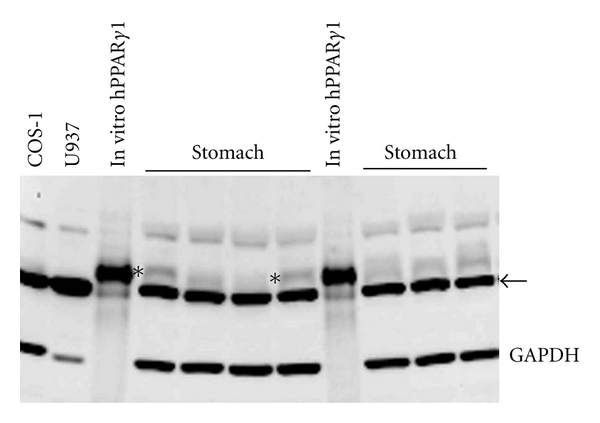
Figure 1.

Western blot showing the comparison of banding patterns in COS-1 cell lysate, U937 cell lysate, in vitro translated human PPARγ1, and tissue lysate from human fetal stomach samples. The ~55 kD band of human PPARγ1 and corresponding band in stomach tissue lysate is marked with an asterisk (∗). The nonspecific, cytoplasmic actin band is marked with an arrow.
