
Figure 1.
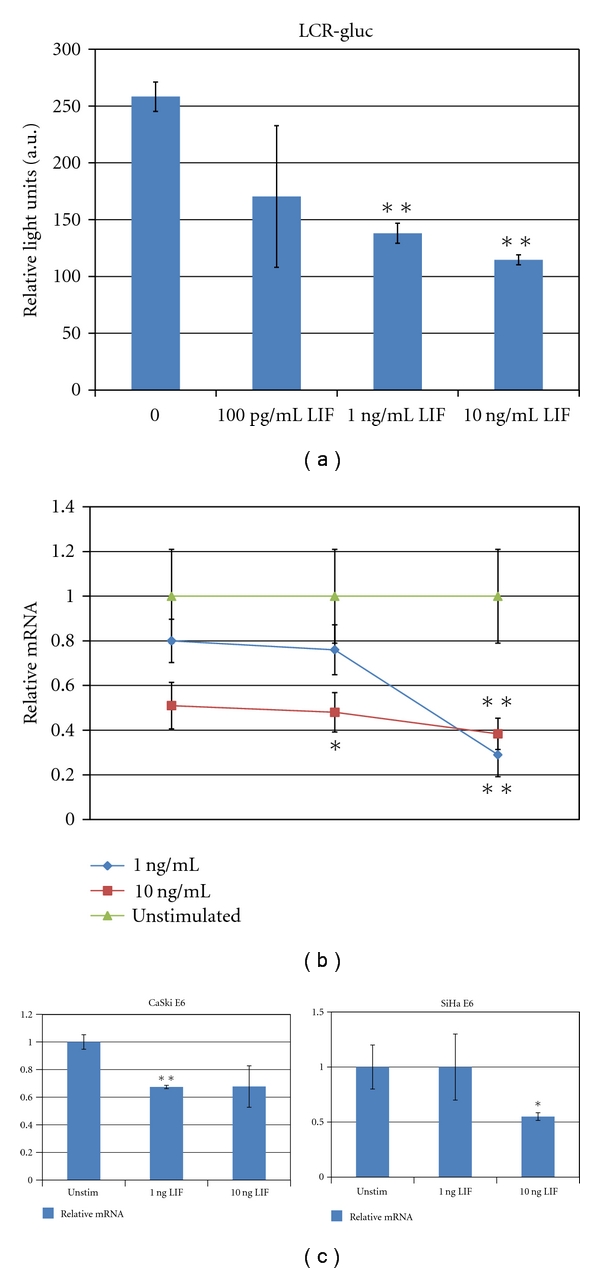
(a) Luciferase expression in LIF-treated and untreated SiHa pGLuc cells. (b) CaSki cells were treated with the indicated concentrations of LIF for 24 hours. Quantitative real-time PCR was performed as described. Error bars represent standard error of the mean. (c) CaSki and SiHa cells were treated with the indicated concentrations of LIF for 72 hours. Quantitation of E6 relative to β-actin is represented in arbitrary units. Error bars represent standard error of the mean. Asterisks represent significance (*P < .1, **P < .05).