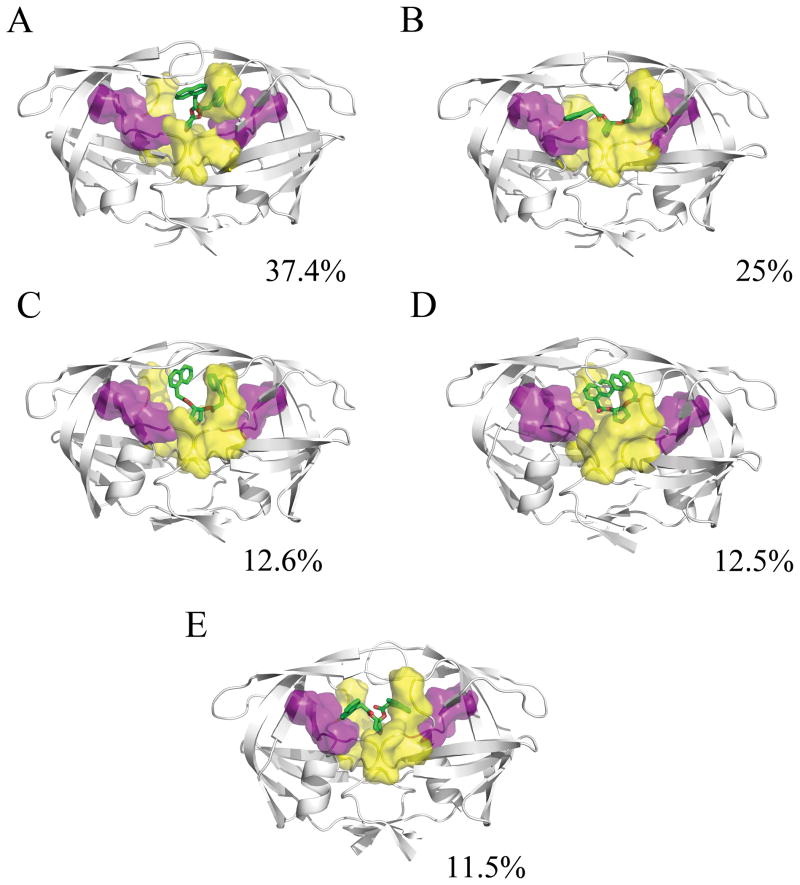
Figure 3.
Representative structures from the MD simulation of the HIVp+α complex, taken from the last 5ns of each 25ns trajectory. The α ligand is shown in green, the S1/S1′ site is shown in yellow, and the S2/S2′ site is shown in purple. The conformational families for the α ligand illustrate its strong preference for forming one interaction between the naphthyl ring and the eye site, while the other naphthyl ring flips to interact at the S1/S1′ or S2/S2′ site, and the pyrrole maintains a hydrogen-bonding interaction with the catalytic aspartic acids.

