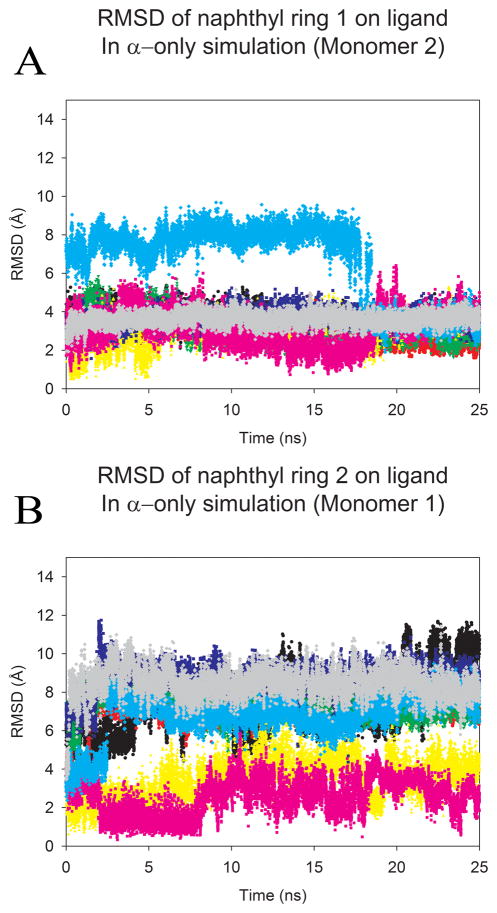
Figure 4.
The overall RMSD from the crystal pose calculated for each naphthyl ring of the ligand in HIVp+α over the length of the production run. Trajectories were first fit to the Cα core of the 3BC4 crystal structure. Each color represents a single production run; and denotes the same run for each plot. A) highlights the RMSD of the first naphtyhl ring over time, (B) highlights the RMSD of the second naphtyhl ring over time. As noted in figure 1, we have used the convention of labeling monomers 1 and 2 based on the behavoir of the ligand, where better agreement with the initial position in the eye is oriented to the right in the figures and labeled as monomer 2 in the graphs. An RMSD of 6.2–7.9 Å indicates occupation of the S2/S2′ site, while an RMSD of 7.8–10.1 Å indicates occupation of the S1/S1′ site.

