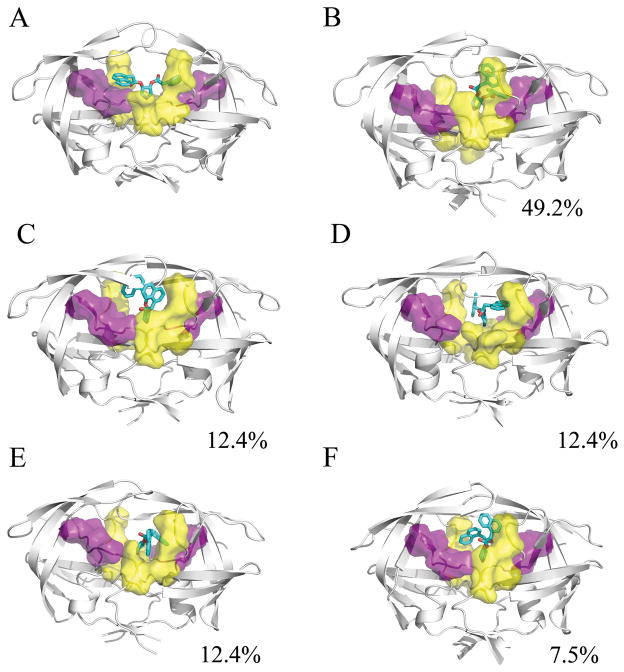
Figure 5.
A) The initial minimized conformation of the α′ ligand. B–F) Representative structures from the 200ns MD simulation of the HIVp-α′ complex. The α′ ligand is shown in cyan, the S1/S1′ site is shown in yellow, and the S2/S2′ site is shown in purple. Although the simulations were initiated with the naphthyl rings occupying traditional subsites of the active site, one naphthyl ring moves to form interactions at the eye site over the course of all eight independent simulations. The second ring remains in contact with the S1 or S2 site.

