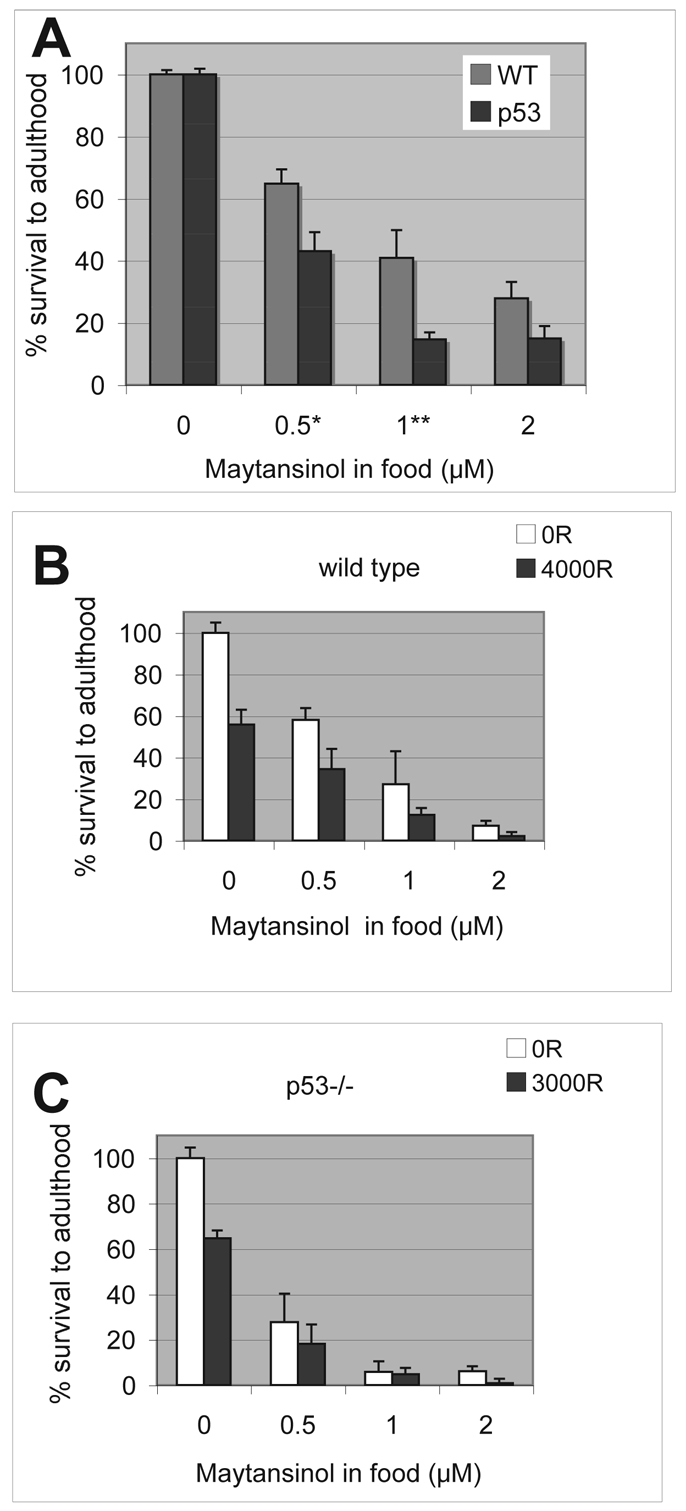
Fig. 2.

Sensitivity of Drosophila larvae to maytansinol and IR. Feeding-stage third instar larvae were placed in new food containing different concentrations of maytansinol. Survival was calculated as the fraction of pupae that eclosed as adult (empty pupa cases/total) and normalized to survival of solvent-treated controls for each respective genotype. Error bars extend beyond fractional survival of 1.0 for solvent controls (0 μM drug) simply because of normalization. WT, wild type; p53, p53 homozygous mutants. The data shown are averages from over 2500 pupae per genotype examined in four (wild type) or five (p53) different experiments. Error bar = 1 s.e.m. *P<0.05; **P<0.01 in Student’s t-test. (B,C) Feeding-stage third instar larvae were irradiated with doses of X-ray as shown and placed in new food containing different concentrations of maytansinol. The dose of X-ray was chosen to achieve approximately 50% killing for each genotype. Most, if not all, irradiated larvae formed pupae in these experiments. Survival was calculated as the fraction of pupae that eclose as adults from the pupae case. The data shown are from one set of experiments in which data from five biological replicates were averaged per genotype per treatment. These data sets were two of several used to compute averages show in A, which are higher than in these particular experiments but still within one s.d. Error bar = 1 s.d. Error bars extend beyond fractional survival of 1.0 for solvent controls (no drug) simply because of normalization. 100 R = 1 Gy.
