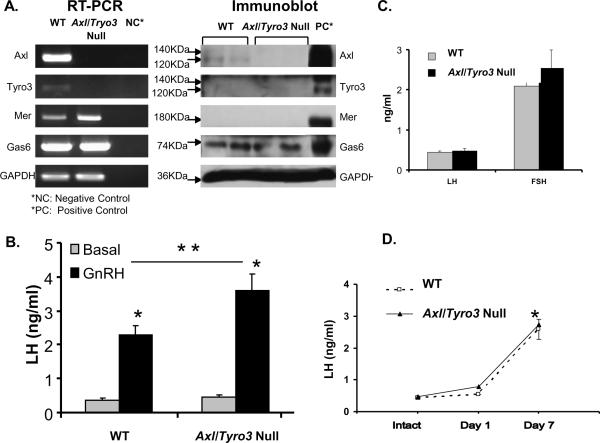
Fig. 5.
Pituitary TAM expression and function. Panel A: Expression of TAM family members and their ligand in WT and Axl/Tyro3 null pituitaries. Panel B: LH levels following GnRH administration (200 ng/kg s.c.) in intact WT (n = 8) and Axl/Tyro3 null (n = 9) female mice. Hormone levels were determined on trunk blood as described in Methods. Panel C: LH and FSH levels in intact WT and Axl/Tyro3 null mice. For LH levels, vaginal smears were performed on random cycling WT (n = 12) and Axl/Tyro3 null (n = 18) mice and mice sacrificed during diestrous and proestrous. For FSH levels, WT (n = 5) and Axl/Tyro3 null (n = 6) random cycling mice were sacrificed in the morning. Panel D: LH levels post ovariectomy in WT and Axl/Tyro3 null female mice (n = 4 and 6, respectively at day 7, *p<0.05, **p<.01, see methods for details).

