
Fig. 6.
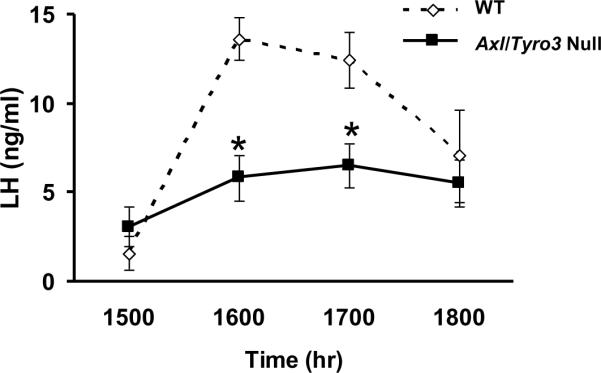
Axl/Tyro3 null mice are unable to mount a normal LH surge. The graph depicts LH levels in groups of mice after ovariectomy and sex hormone replacement. At the 1500, 1600, 1700, and 1800 time-points, WT n = 6, 7, 7 and 6 and Axl/Tyro3 null n = 6, 8, 9 and 8, respectively. Mean LH levels ± SEM in WT (dashed line) and Axl/Tyro3 null (solid line) mice (*p<0.05, see methods for details).