
Figure 5.
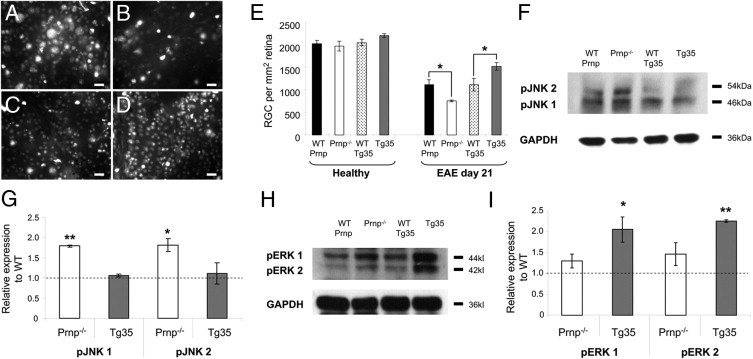
Neurodegeneration of RGCs at EAE day 21 and influences of PrPC on intracellular signaling pathways. A–D: Representative images of retinal whole mounts demonstrate Fluoro-Gold–labeled RGCs at EAE day 21, taken from WT-Prnp (A), Prnp−/− (B), WT-Tg35 (C), and Tg35 (D) mice. E: Quantification of the number of RGCs in healthy (nonimmunized) age-matched mice demonstrates no significant differences between all mice strains, and quantification of the number of surviving RGCs at EAE day 21 demonstrates that relative to their WT counterparts, a significant decrease in the number of surviving RGCs is observed in Prnp−/− mice, whereas a significant increase in the number of surviving RGCs is observed in Tg35 mice. F: Representative Western blots using antibodies against phosphorylated forms of JNK 1 and 2 (46 and 54 kDa, respectively). G: Quantification of pJNK 1 and 2 levels (relative to GAPDH levels) in genetically modified mice compared with their WT counterparts. H: Representative Western blots using antibodies against phosphorylated forms of ERK 1 and 2 (44 and 42 kDa, respectively). I: Quantification of pERK 1 and 2 levels (relative to GAPDH levels) in genetically modified mice as compared with their WT counterparts. Scale bars: 20 μm (A–D). *P < 0.05. **P < 0.01.