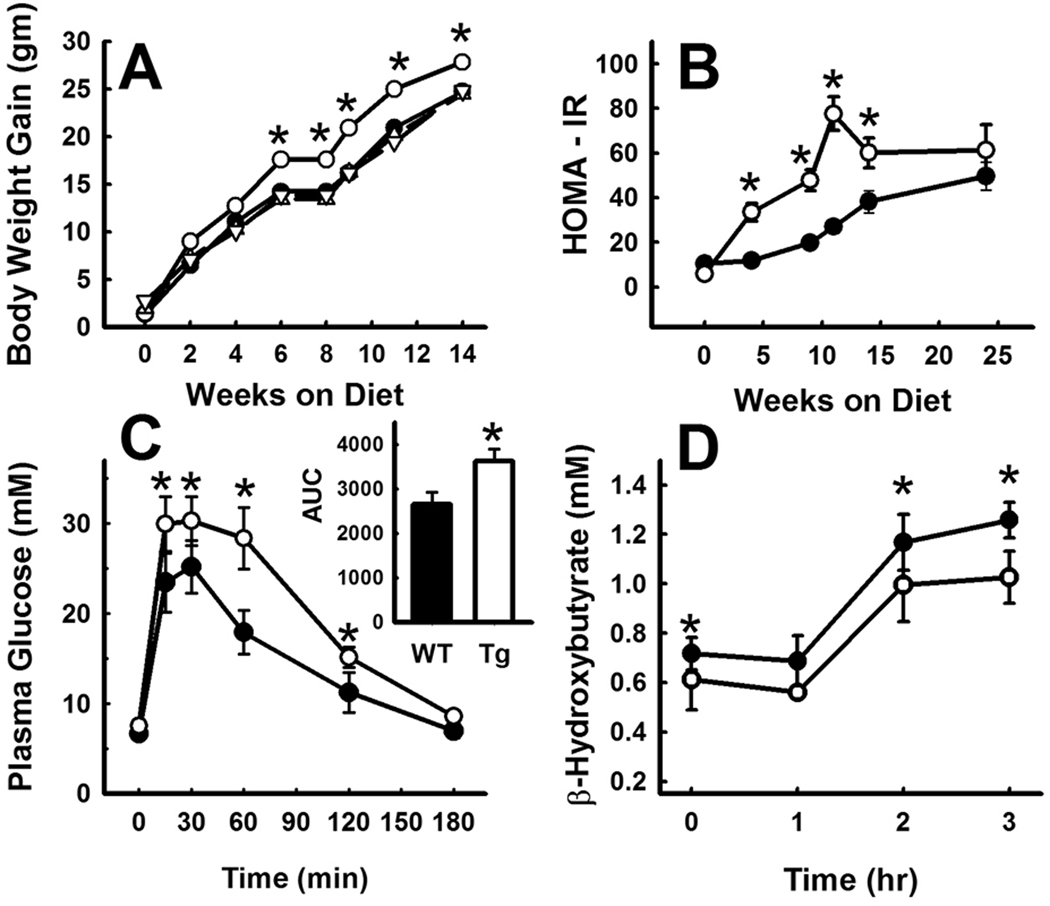
Figure 2.
Diet-induced obesity and diabetes in wild type and PLA2G1B transgenic mice. Panel A shows body weight gain of wild type (filled circles) and PLA2G1B transgenic mouse lines Tg-1 (filled triangles), Tg-2 (open circles), Tg-3 (open triangles), Tg-4 (open inverted triangles) in response to high fat/carbohydrate diet. Data represent mean ± s.e. from 8 mice in each group. Note that the lines for WT, Tg-1, Tg-3, and Tg-4 are superimposable. Panel B shows homeostasis assessment – insulin resistance HOMA-IR) index of high fat/carbohydrate-fed wild type mice (filled circles) and Tg-2 PLA2G1B-transgenic mice (open circles) (n=8 in each group). Panels C and D show plasma glucose and β-hydroxybutyrate levels in wild type (filled circles) and Tg-2 PLA2G1B-transgenic mice (open circles) after overnight fast (time = 0) and after feeding a bolus lipid meal (n=4 mice in each group). The inset to panel C shows areas under the curve determinations of the glucose tolerance tests. * denotes statistical significant differences from the wild type group at P<0.05.

